

Clean Power Now Makes Up 15% Of US Electricity Mix After Near-Record 2022

The American Clean Power Association (ACP) released its comprehensive Clean Power Annual Market Report for 2022 and its Clean Power Quarterly Market Report for Q1 2023, finding that combined US wind, utility solar, and energy storage capacity had the third-largest year on record in 2022 with more than 25 GW of new clean power installed. However, a decline in deployment volume from the previous two years, combined with a historically low Q1 2023, underscore the continued headwinds facing the industry. ACP is the voice of the clean power industry that is powering America’s future, providing cost-effective solutions to the climate crisis while creating jobs, spurring massive investment in the US economy, and driving high-tech innovation across the nation. ACP is uniting the power of America’s renewable energy industry to advance its shared goals and to transform the US power grid to a low-cost, reliable, and renewable power system.
After historic clean energy incentives were signed into law in August 2022, clean power has seen record levels of announced activity, with the development pipeline swelling to nearly 140 GW by the end of Q1 2023 — 11% above where it was at the same point last year. However, ACP said it is too early to see this activity translate into installations, which have slowed for the first time since 2017. “The clean energy revolution is underway,” said ACP CEO Jason Grumet. “We have the technology, financial capital, and workforce to power our economy with clean, affordable, and secure energy. There is broad bipartisan support for American energy innovation. But the clean energy transition will not succeed unless Congress and Governors enable the siting and construction of new energy facilities and support the build out of transmission required to bring clean power to the people.”
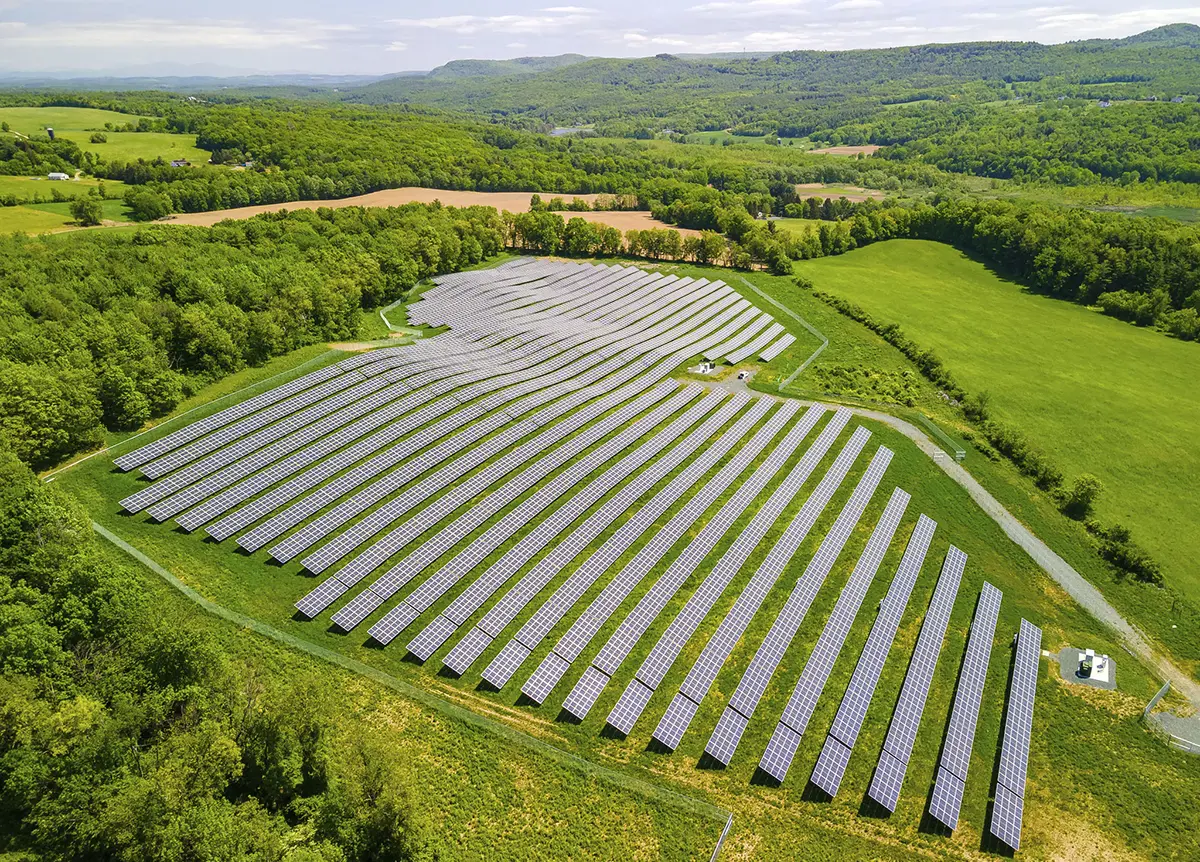
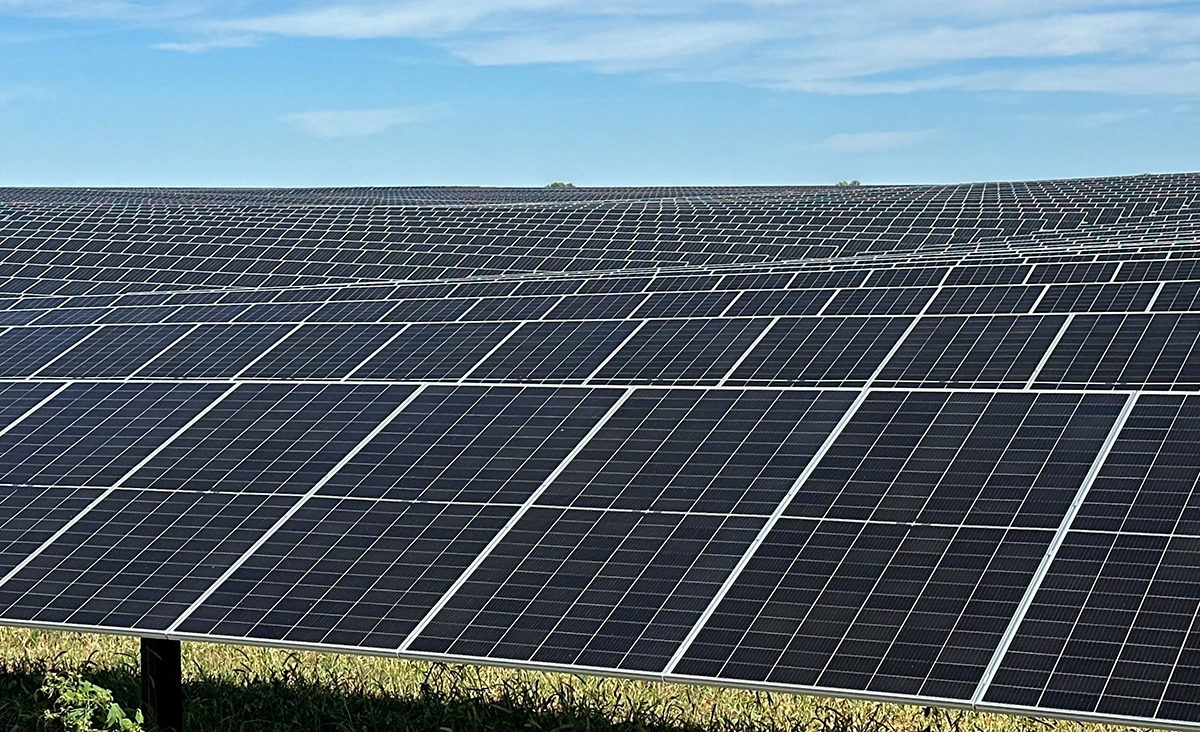
By the end of 2022, nearly 228 GW of clean energy was online, with 4 GW more added in Q1 2023. These resources provide 15% of the nation’s electricity and deliver enough electricity to power the equivalent of more than 62 million households. Clean power dominated new power capacity additions in 2022, comprising nearly 80% of all new grid additions.

Texas added twice as much clean energy capacity as any other state in 2022 (more than 9 GW), maintaining its status as the state with the most operating clean power capacity (nearly 55 GW). Iowa and South Dakota each generated more than half of their electricity from clean power last year.
Energy storage witnessed a record year in 2022 with 4 GW and 12 GWh commissioned, representing an 80% increase in total operating storage capacity. Hybrid project installations in 2022 were 60% higher than in 2021, setting a new record in the hybrid space at nearly 6 GW of installations.
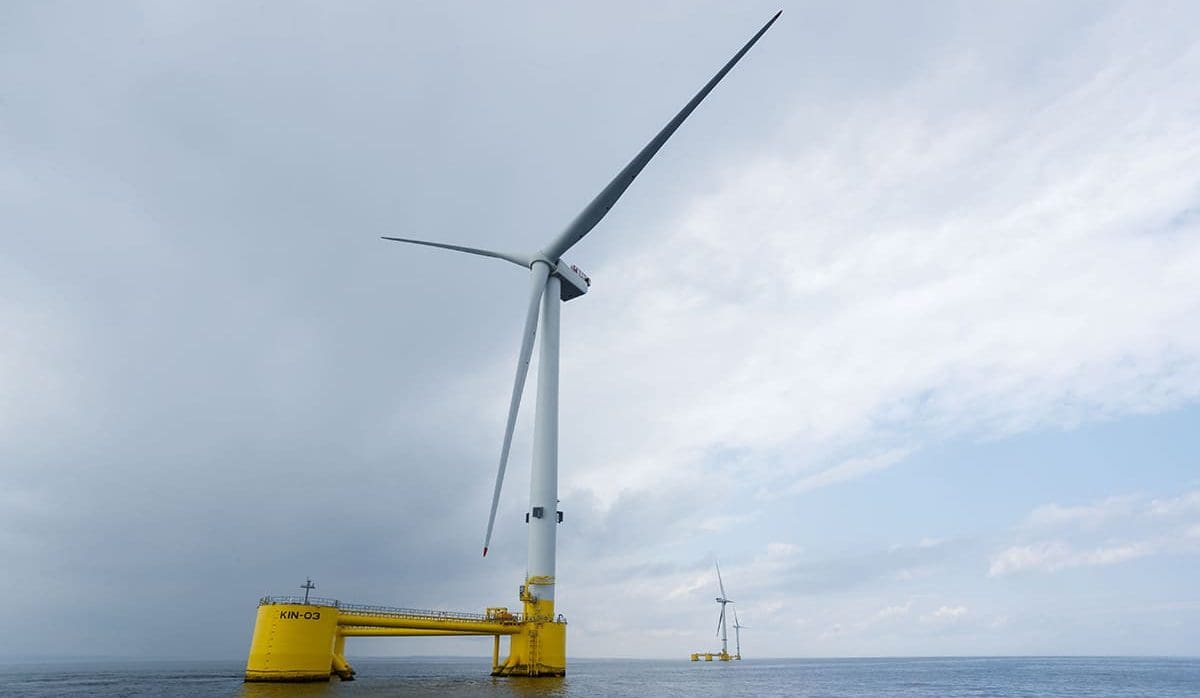
In the nearly 140-GW development pipeline, solar accounts for 59% of all clean power capacity. Land-based wind accounts for 15% of the pipeline, battery storage represents 14%, and offshore wind claims the remaining 13%.

Headwinds And Delays
However, the year’s progress was not enough to continue the annual growth trajectory of US clean power, with the industry seeing a decline in combined installation volume for the first time in five years and the lowest Q1 2023 in three years.
Contributing to the slowdown in installations were delays in 2022 that affected more than 50 GW of projects in late-stage development, with a total of 63.3 GW — equivalent to powering nearly 7 million homes — experiencing delays by the end of Q1 2023. On average, these projects face delays of six months or longer, depriving ratepayers of clean, affordable electricity.
ACP said project delays are primarily due to unclear permitting timelines, trade policy uncertainty, transmission shortages, difficulties sourcing solar panels, unresolved Inflation Reduction Act (IRA) implementation, and interconnection queue challenges (with more than 1741 GW waiting in queues at the end of 2022). These challenges must be addressed to unlock the full potential of the nearly 140 GW of clean energy in the development pipeline.
ACP’s Key Highlights
- Third-Largest Year: 25.5 GW of new clean power was commissioned in 2022, making it the third-largest year on record and bringing the total amount of American clean power online by year’s end to nearly 228 GW.
- Leading Source Of New Power: Clean power represented 79% of all new capacity added in 2022.
- Powering More Of America: By the end of Q1 2023, wind and solar provided 232 GW of clean energy, more than 15% of the country’s electricity and equivalent to powering more than 62 million homes.
- Net-Zero Progress: Maintaining last year’s project installation volume would provide only 30% of what is needed to reach a net-zero grid by 2035.
- Significant Delays: By the end of 2022, 53 GW of projects were experiencing delays due to ongoing regulatory, supply chain, and interconnection challenges, contributing to a 15% decline in deployment volume from 2021. 63.3 GW of clean power was delayed by end of Q1 2023.
- Development Pipeline: 139 GW of clean energy projects were under development at the end of Q1 2023.
- Storage Soars: In 2022, energy storage witnessed a record year with 4 GW and 12 GWh commissioned, representing an 80% increase in total operating storage capacity.
- Growing Workforce & Investment: The clean power industry employs 443,000 workers and invested $35 billion in capital investment in 2022.
- United States of Clean Energy: Clean power has projects or manufacturing facilities in 93% of Congressional districts. Projects can be found in all 50 states.
- Booming Manufacturing: There are 550 US manufacturing facilities dedicated to producing components and parts for wind, solar, and storage projects in the clean power industry — and since the passage of the IRA, 47 new clean energy manufacturing facilities or expansions have been announced, bringing more than 18,000 new American jobs.
Key Highlights — Q1 2023
- Lowest Q1 Since 2020: Q1 2023 saw a 36% drop in clean power installations (4079 MW) compared to Q1 2022.
- 95 project phases were commissioned across 27 states, with Florida and Texas leading.
- Sector Snapshot: Solar led the quarter (2200 MW), followed by wind (1418 MW) and battery storage (461 MW).
- Delays: Regulatory challenges led to significant project delays, especially in the solar sector, with 7.3 GW of clean power capacity expected online in Q1 delayed, for a total of 63.5 GW of clean power delayed by end of Q1.
- 90% of Q1 delayed capacity expected to come online later in 2023.
- Pipeline: The development pipeline grew 11% from Q1 2022 to 139 GW, dominated by solar at 59%.
- PPAs: New Power Purchase Agreement (PPA) announcements fell by 24% to 3.8 GW, with corporate buyers leading at 63%.

139-GW Development Pipeline By Technology
The Clean Power Market Reports for 2022 and Q1 2023 are comprehensive overviews of the US wind, utility solar, and energy storage markets, containing in-depth analysis of key industry statistics, trends, and rankings. The 180-page annual report and the Q1 2023 report are available exclusively to ACP members.
A public website with interactive data from the 2022 annual report can be viewed here.


