


This article was written by Paul McArdle.
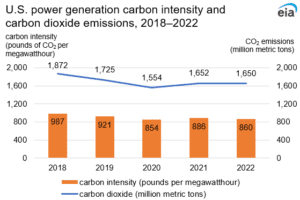
US carbon dioxide (CO2) emissions from power generation fell slightly in 2022 to 1650 million metric tons from 1652 million metric tons in 2021, a 0.1% reduction. This modest decrease came in the face of record high US power generation in 2022 at 4230 million megawatt hours (MWh), a 2.9% increase compared with 2021 generation (4110 million MWh). Offsetting this uptick in generation was a 3% reduction in the carbon intensity of power generation from 886 lb. of CO2 per MWh in 2021 to 860 lb. CO2/MWh in 2022.
The reduction in carbon intensity was driven by both the displacement of coal by natural gas and the increased market share of non-emitting renewable generation. Natural gas (970 lb. CO2/MWh in 2022) increased from 38.4% of total net generation in 2021 to 39.9% in 2022, while coal (2257 lb. CO2/MWh in 2022) decreased from 21.9% of total net generation in 2021 to 19.7% in 2022. Meanwhile, non-emitting renewable generation (wind, hydroelectric, and solar generation) expanded from 18.1% of total net generation in 2021 to 19.7% in 2022.
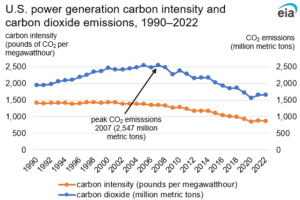
The fall in power generation CO2 emissions during the recent five years is part of a longer-term downward trend in emissions since power generation emissions peaked at 2547 million metric tons in 2007. During the 1990 to 2007 period, power generation CO2 emissions increased from 1954 million metric tons in 1990 to 2547 million metric tons in 2007, an increase of 30%. The increase was mainly driven by a 37% increase in power generation demand in the face of flat carbon intensity. Carbon intensity only declined 4.7% during the 1990 to 2007 period.
Between 2007 and 2022, power generation emission levels fell by 35%. This trend has been driven by a 37% decrease in carbon intensity in the presence of nearly flat power generation demand, which is up only 1.8% since 2007. The displacement of coal by natural gas and the increased use of non-emitting renewable generation sources have caused carbon intensity to decline since 2007. Natural gas’s share of generation increased from 21.6% of total generation in 2007 to 39.9% in 2022, while coal’s share fell from 48.5% to 19.7%. Non-emitting renewables, meanwhile, went from 6.8% of net generation in 2007 to 19.7% in 2022.
These national trends, however, only tell part of the story because the carbon intensity of power generation varies significantly by state and census division. In 2022, the carbon intensity of power generation at the state level ranged from a low of 13 lb. CO2/MWh in Vermont to 1960 lb. CO2/MWh in West Virginia. On a regional basis, the Pacific (365 lb. CO2/MWh), New England (588 lb. CO2/MWh), Middle Atlantic (638 lb. CO2/MWh), and South Atlantic (814 lb. CO2/MWh) census divisions all have emissions rates below the national average. These census divisions tend to have a high percentage of generation from renewable sources or a combination of high renewable and nuclear sources.
Census divisions with emissions rates above the national average are clustered in the center of the country: the West South Central (902 lb. CO2/MWh), East South Central (988 lb. CO2/MWh), Mountain (1029 lb. CO2/MWh), East North Central (1060 lb. CO2/MWh), and West North Central (1073 lb. CO2/MWh) census divisions. In these census divisions, coal still plays an important role in power generation, although several states in these census divisions — such as South Dakota, Oklahoma, and Iowa — are below the national average emissions rate due to the increased use of wind power.
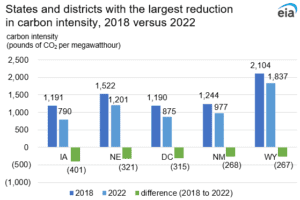
Despite the large statewide variance in carbon intensity levels, most states are reducing the carbon intensity of their power generation. Just as carbon intensity has been dropping at the national level, it is also dropping at the state level; 42 states and the District of Columbia reduced the carbon intensity of their power generation in 2022 relative to 2018. The states that reduced their carbon intensity the most between 2018 and 2022 were Iowa, Nebraska, New Mexico, and Wyoming. The District of Columbia also reduced its carbon intensity significantly over this time frame.
A strong increase in wind generation helped to lower carbon intensities in Iowa, Nebraska, and New Mexico. In Wyoming, both the displacement of coal by natural gas and increased wind generation helped push emissions rates lower. In the case of the District of Columbia, solar generation went from 0% of total generation in 2018 to 14% in 2022, helping to lower the carbon intensity.
About The Author
Paul McArdle is an analyst for the US Energy Information Administration.


