The US Energy Information Administration (EIA) has published its Annual Energy Outlook 2023 (AEO2023). The report explores long-term energy trends in the United States. AEO2023 includes a reference case and 12 side cases that explore key areas of uncertainty about how energy markets will develop.
What follows is an excerpt from AEO 2023. The entire report, as well as details on each reference case, can be viewed HERE.
Under the Paris Agreement, the United States set a goal to reduce economy-wide greenhouse gas emissions by 50% to 52% of 2005 levels by 2030. The EIA projects lower US energy-related carbon dioxide (CO2) emissions in 2030 relative to 2005 in the AEO2023 Reference case and all side cases (Figure 1). CO2 emissions are most sensitive to economic growth and assumptions related to the cost of zero-carbon generation technology. Combinations of these two sets of assumptions form the upper and lower bounds of projected CO2 emissions. Emissions decrease by 25% in 2030 relative to 2005 under the combined high economic growth and high zero-carbon technology cost assumptions and by as much as 38% under low economic growth and low zero-carbon technology cost assumptions. Both cases hinge on specific assumptions regarding the relationship between economic growth and zero-carbon technology development. In the AEO2023’s High Economic Growth case, emissions fall initially and then begin to increase again in 2040 as industrial activity and travel (measured in vehicle miles traveled) increase, surpassing emissions reductions from the electric power sector.
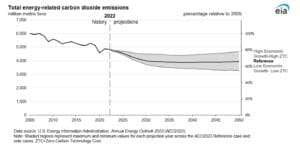
The largest variations in projected US CO2 emissions across cases occur in the electric power, transportation, and industrial sectors. Although economic growth assumptions affect consumption and, in turn, projected CO2 emissions in all sectors, different case-specific assumptions affect sectors differently. For example, emissions from the electric power sector are particularly responsive to assumptions about the cost of zero-carbon technologies, and transportation sector emissions are sensitive to assumptions about fossil fuel supply and cost, particularly oil and petroleum products.
Renewables displace fossil fuels in the electric power sector due to declining renewable technology costs and rising subsidies for renewable power. Economic growth paired with increasing electrification in end-use sectors results in stable growth in US electric power demand through 2050 in all cases. Declining capital costs for solar panels, wind turbines, and battery storage, as well as government subsidies such as those included in the Inflation Reduction Act (IRA), result in renewables becoming increasingly cost effective compared with the alternatives when building new power capacity.
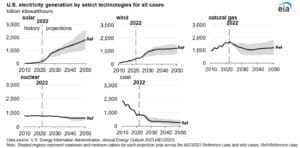
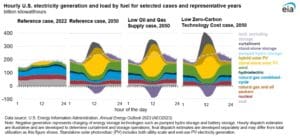
Renewables are increasingly meeting power demand throughout the projection period (Figure 2). Natural gas, coal, and nuclear generation shares decline. Renewable power outcompetes nuclear power, even in the Low Zero-Carbon Technology Cost (ZTC) case, which evaluates the impact of more aggressive cost declines for nuclear and renewables than the reference case. Most natural gas-fired generation comes from combined-cycled power plants as opposed to simple-cycle combustion turbines. Uncertainty in natural gas prices across cases leads to various projections for combined-cycle units in the short term, but in the long term, natural gas demand from the electric power sector stabilizes across all cases.
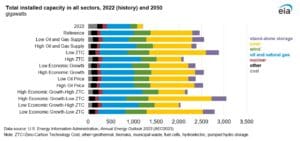
In order to meet increasing demand for electric power throughout the projection, total installed power capacity close to doubles across most cases, even in the Low Economic Growth case (Figure 3). Cases with a higher share of renewables in the generation mix have higher total grid capacity due to the inherently lower capacity factors of solar and wind compared with coal, nuclear, and combined-cycle plants.
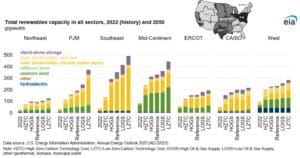
The EIA projects that renewable power capacity will increase in all regions of the United States in all AEO2023 cases, although regional resource availability results in varying renewable resource mixes across regions (Figure 4). Across all cases, between 40% and 60% of the renewable power capacity in the Mid-Continent region in 2050 comes from wind, and the Southeast and the region managed by the California Independent System Operator (CAISO) have large shares of solar and a small amount of wind power capacity in all cases.
Once built and when the resource is available, wind and solar generation outcompete other technologies for system dispatch because they have zero fuel costs. Across all AEO2023 cases, some renewable generation is left unused and curtailed, typically midday when solar generation can exceed demand in some regions and seasons. Battery capacity is built in all cases to store and dispatch some of this otherwise unused generation in later hours, decreasing reliance on fossil fuel capacity, such as natural gas-fired peaking units or load-following combined-cycle units (Figure 5). Battery storage is also used to replace natural gas-fired capacity to provide reserve capacity. In the reference case in 2050, 160 GW of standalone battery storage capacity will be deployed, and deployment varies between 40 GW and 260 GW in the other cases.
As a result of renewables growth, the EIA projects that US coal-fired generation capacity will decline sharply by 2030 to about 50% of current levels (about 200 GW) with a more gradual decline thereafter. The EIA projects between 23 GW and 103 GW of coal-fired capacity operating in 2050 (Figure 6). The IRA provides additional incentives to wind and solar power generation, which accelerates the near-term decline of electric power sector coal-fired generating capacity and hastens the timeline for retirement in the US coal fleet.
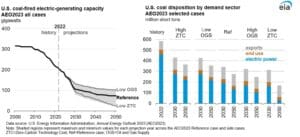
Coal consumption in the US electric power sector in the reference case drops to 189 million short tons (MMst) in 2030 and to 131 MMst in 2050 from 458 MMst in 2022. Coal disposition, which includes exports and consumption by the electric power sector and other end-use sectors, declines to a low of 170 MMst in 2050 in the Low ZTC case. In a high natural gas price environment, such as in the Low Oil and Gas Supply case, coal disposition could remain as high as 350 MMst in 2050. In all cases, annual coal exports average about 110 MMst in 2050, and end-use coal demand averages about 36 MMst. The ratio of coal exports to domestic coal consumption generally increases through the projection period in all cases. The majority of domestically produced coal is exported by 2050 in the Low ZTC case, 45% is exported in the High Oil and Gas Supply case, which are the two cases that have the least coal demand from the electric power sector. Even in cases with more aggressive retirement of coal-fired power plants, such as the Low ZTC case, some of the relatively newer and more efficient coal power plants remain online across the United States because they can provide cheap dispatchable power to the grid.


