100 weeks ago, we published our first weekly update for ESGreview.net. A little over two years later, we’re celebrating the growth of our magazine, subscribers, web viewers, more than 3000 Instagram followers, and our community at large.
At the same time, we recognize we have a long way to go. The energy shortage in Europe has reminded the developed world that emissions reductions mean nothing without energy security and availability. Coal and oil are seen as reliable and easily accessible with today’s infrastructure, charting an uphill battle for alternative fuels and low-carbon industries.
To overcome this challenge, we must work together to foster sustainable decarbonization that is realistic and practical. The good news is that many forward-thinking industries are experiencing accelerated growth. Let’s look at the strides that have been made since ESG Review launched in 2020. The data may surprise you!
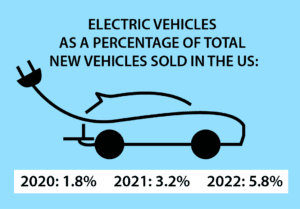
Electric Vehicles As A Percentage Of Total New Vehicles Sold In The United States
2020: 1.8%
2021: 3.2%
2022: 5.8%
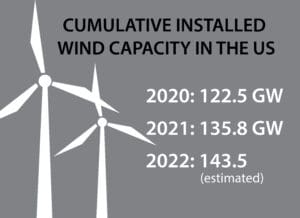
Cumulative Installed Wind Capacity In The United States
2020: 122.5 GW
2021: 135.8 GW
2022: 143.5 GW (estimate)
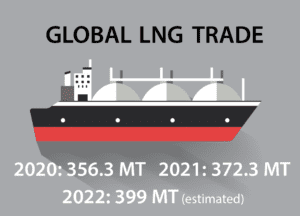
Global LNG Trade
2020: 356.3 MT
2021: 372.3 MT
2022: 399 MT (estimate)
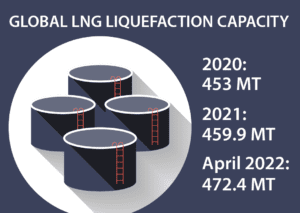
Global LNG Liquefaction Capacity
2020: 453 MT
2021: 459.9 MT
April 2022: 472.4 MT
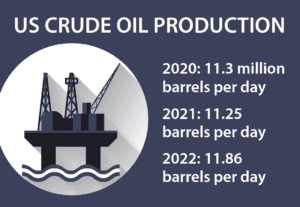
US Crude Oil Production
2020: 11.3 million barrels per day
2021: 11.25 million barrels per day
2022: 11.86 million barrels per day
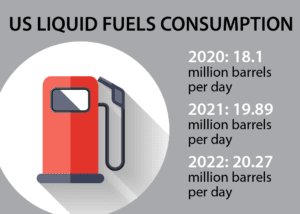
US Liquid Fuels Consumption
2020: 18.1 million barrels per day
2021: 19.89 million barrels per day
2022: 20.27 million barrels per day
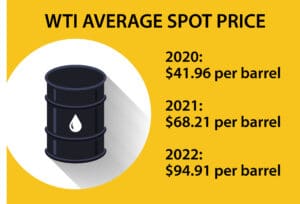
WTI Average Spot Price
2020: US$41.96 per barrel
2021: US$68.21 per barrel
2022: US$94.91 per barrel

Percentage Of S&P 500 Companies That Publish ESG Reports
2020: 92%
2021: 95%
2022: 96%
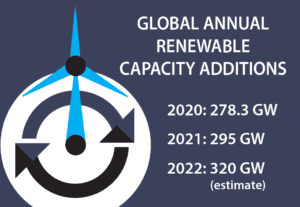
Global Annual Renewable Capacity Additions
2020: 278.3 GW
2021: 295 GW
2022: 320 GW (estimate)
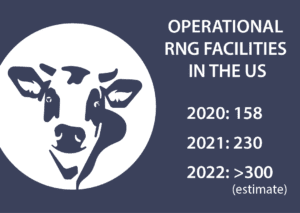
Operational RNG facilities In The United States
2020: 158
2021: 230
2022: >300 (estimate)


