The US Energy Information Administration (EIA) released its Annual Energy Outlook for 2021 which contains, among other things, the levelized costs of new generation resources entering into service in 2026. The levelized cost of energy (LCOE) is one of the best ways to compare the costs of electricity producing assets over the course of their useful life. Some of the EIA’s key inputs for calculating the LCOE include capital costs, fuel costs, fixed and variable operations and maintenance costs, financing costs, and an assumed utilization rate for each plant type. It’s not a perfect science since technological and regional characteristics, as well as the resource mix of a region and the displacement of existing resources affects profitability, but it’s a good estimate.
General Data
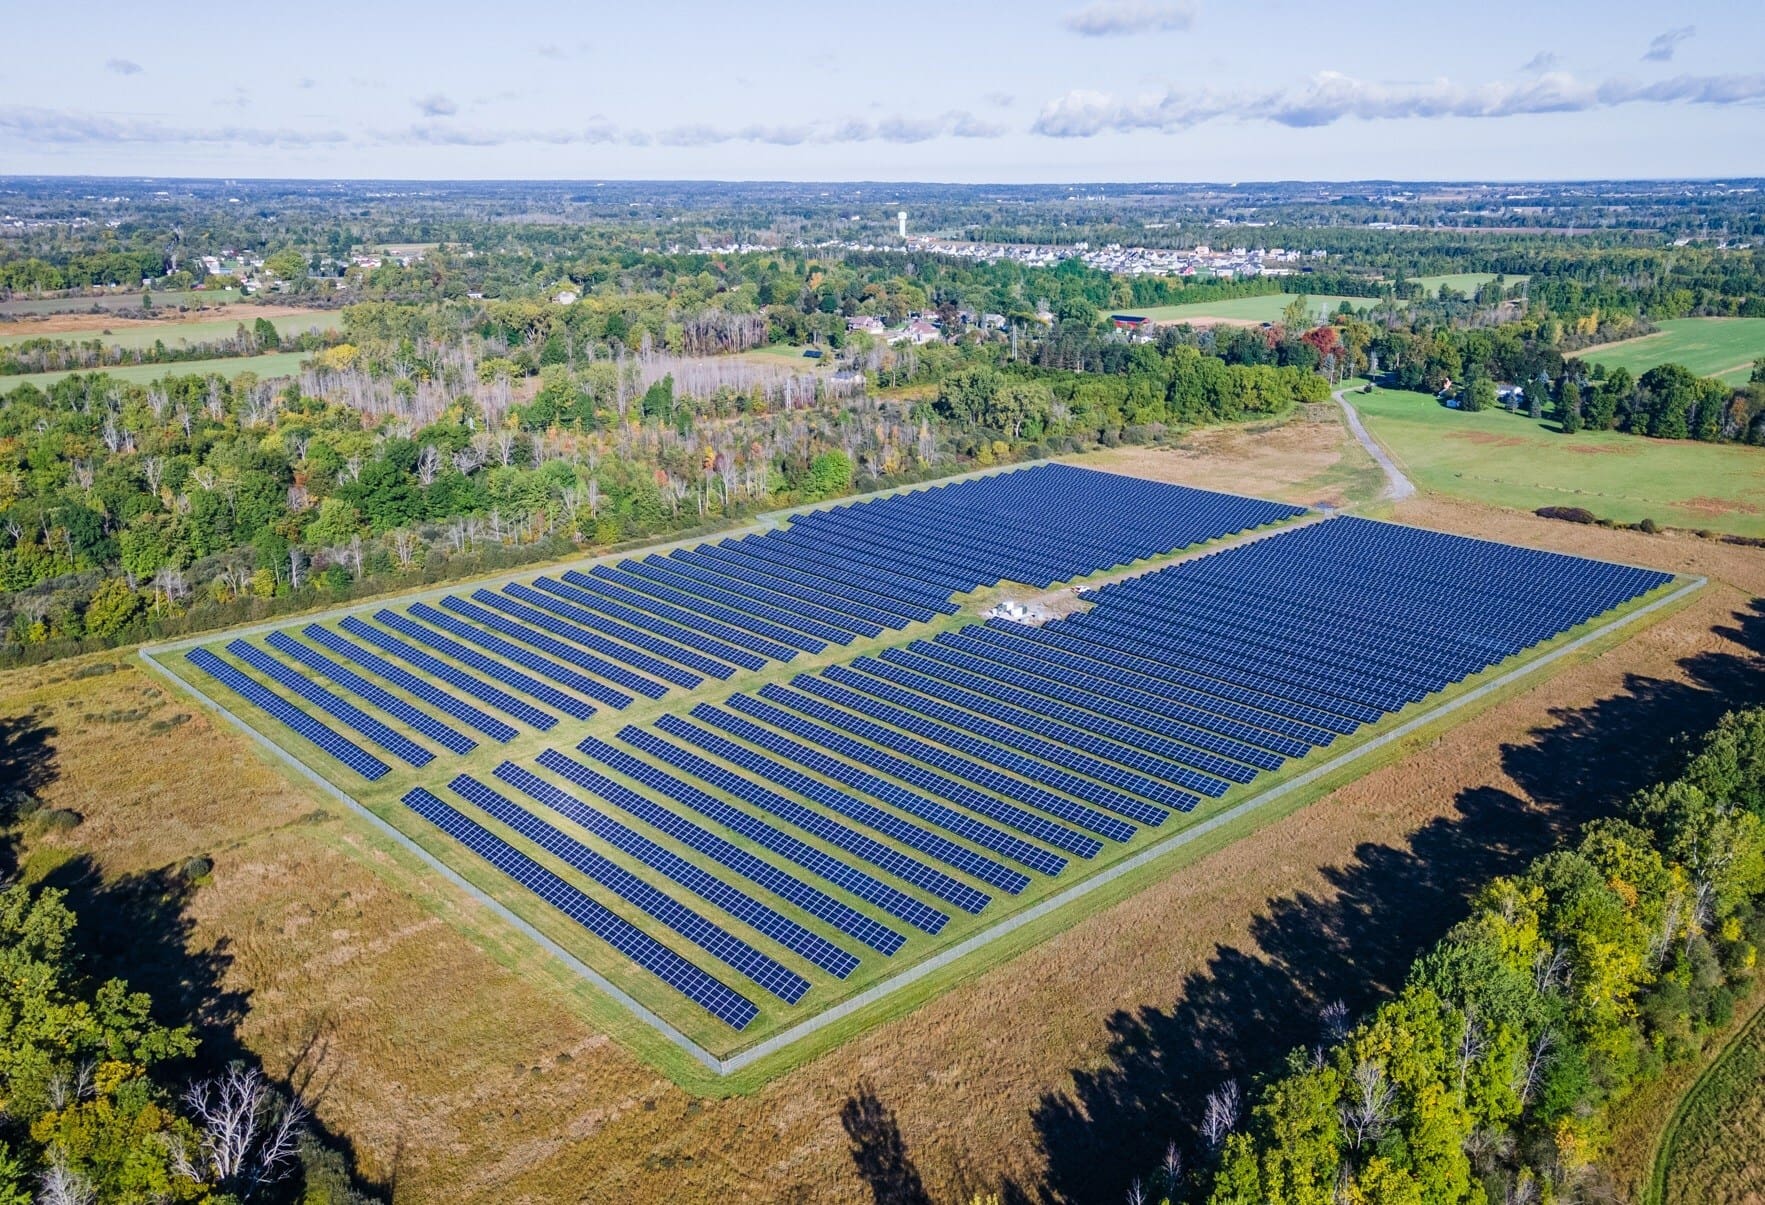
According to the report, new onshore wind, and solar photovoltaic (PV) projects entering into service in 2026 will be cheaper than even the most efficient source of fossil fuel-based power generation — natural gas-fired combined cycle plants. Like renewables, fossil-fuel based power generation costs have also come down over the years. But the EIA isn’t estimating any significant capacity additions for hydroelectric, biomass, advanced nuclear, or coal. So much so that it has labeled those sources as “NB” or “not built” in its forecast. The following table shows the estimated capacity weighted LCOE for new resources entering service in 2026. The data is presented in 2020 US dollars per megawatt hour (MWh).
| Plant Type | 2026 Estimate (In MWh) |
| Non-Dispatchable Technologies | |
| Onshore Wind | US$31.45 |
| Offshore Wind | US$115.04 |
| Solar PV | US$31.30 |
| Hydroelectric | NB* |
| Dispatchable Technologies | |
| Geothermal | US$36.02 |
| Biomass | NB* |
| Advanced Nuclear | NB* |
| Combustion Turbine | US$199.01 |
| Combined Cycle | US$34.51 |
| Ultra-Supercritical coal | NB* |
*Not Built
Data Source: US EIA
It’s worth mentioning that these cost estimates exclude tax credits. The EIA does estimate that geothermal will have a levelized tax credit of US$1.86 per MWh and solar will receive a credit of US$2.26 per MWh, but these are a far cry from incentives just a few years ago. In fact, the EIA assumes the phaseout of both the production tax credit (PTC) and the investment tax credit (ITC) in its report, since the forecast is for new projects entering into service in 2026 when tax credits should be negligible.
Regional Data
The report also includes minimum and maximum regional variations by plant type, which can be useful for gauging minimum and maximum costs. Interestingly enough, onshore wind varies dramatically more than solar PV. Looking at the “without tax credit” numbers, geothermal has the lowest maximum LCOE, followed by solar PV, and then combined cycle. Although solar PV has the lowest average costs, onshore wind has the lowest minimum cost. From the data, it’s clear to see that tax credits play a minor role in both the average capacity weighted LCOE and regional variations in LCOE.
Below is data that shows the regional variation in LCOE for new resources entering service in 2026. The data is presented in 2020 US dollars per MWh.
| Without Tax Credits | With Tax Credits | |||||||
| Plant Type | Minimum | Simple Average | Capacity Weighted Average | Maximum | Minimum | Simple Average | Capacity Weighted Average | Maximum |
| Non-Dispatchable Technologies | ||||||||
| Onshore Wind | US$26.33
|
US$36.93 | US$31.45 | US$56.94 | US$26.33 | US$36.93 | US$31.45 | US$56.94 |
| Offshore Wind | US$97.52
|
US$120.52 | US$115.04 | US$149.53 | US$97.52 | US$120.52 | NB* | US$149.53 |
| Solar PV | US$27.28 | US$32.78 | US$31.30 | US$43.90 | US$25.32 | US$30.43 | US$29.04 | US$40.67 |
| Hydroelectric | US$41.92
|
US$55.26 | NB* | US$70.60 | US$41.92 | US$55.26 | NB* | US$70.60 |
| Dispatchable Technologies | ||||||||
| Geothermal | US$33.41
|
US$36.40 | US$36.02 | US$39.55 | US$31.80 | US$34.49 | US$34.16 | US$37.59 |
| Biomass | US$70.95
|
US$89.21 | NB* | US$130.97 | US$70.95 | US$89.21 | NB* | US$130.97 |
| Advanced Nuclear | US$64.82
|
US$69.39 | NB* | US$78.15 | US$58.52 | US$63.10 | NB* | US$71.85 |
| Combustion Turbine | US$170.79 | US$194.87
|
US$199.01
|
US$244.71 | US$170.79 | US$194.87 | US$199.01 | US$244.71 |
| Combined Cycle | US$31.67 | US$37.11 | US$34.51 | US$44.68 | US$31.67 | US$37.11 | US$34.51 | US$44.68 |
| Ultra-Supercritical Coal | US$64.98 | US$72.78 | NB* | US$88.45 | US$64.98 | US$72.78 | NB* | US$88.45 |
*Not Built
Data Source: US EIA


